Evolutionary Coupling Analysis
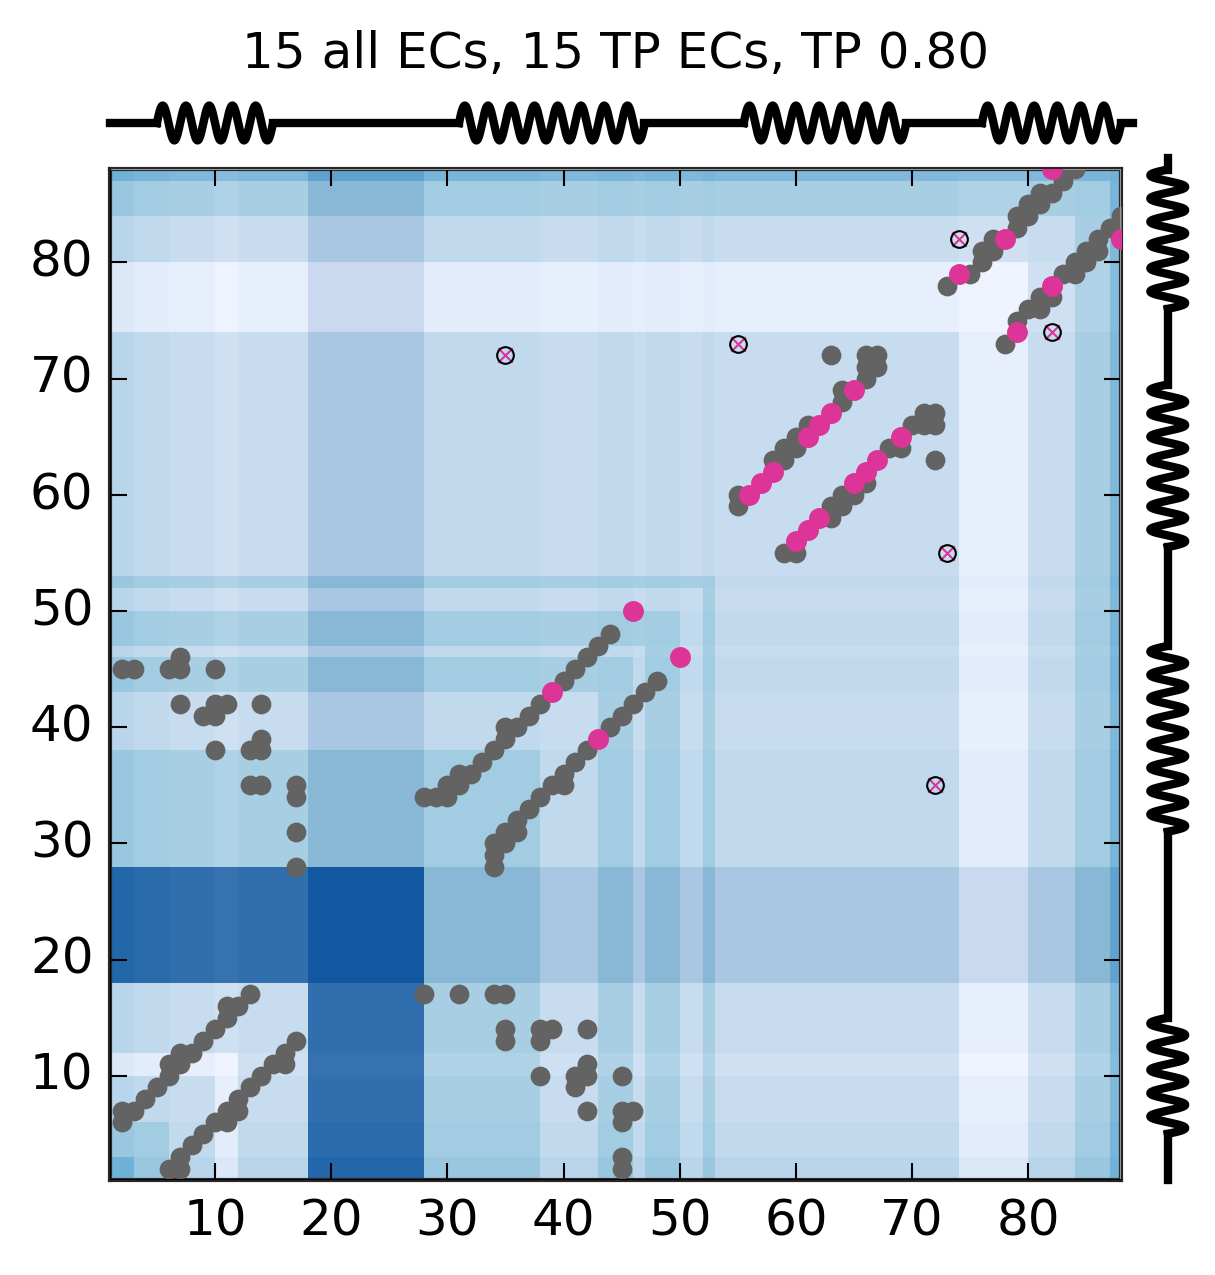
Predicted and experimental contacts
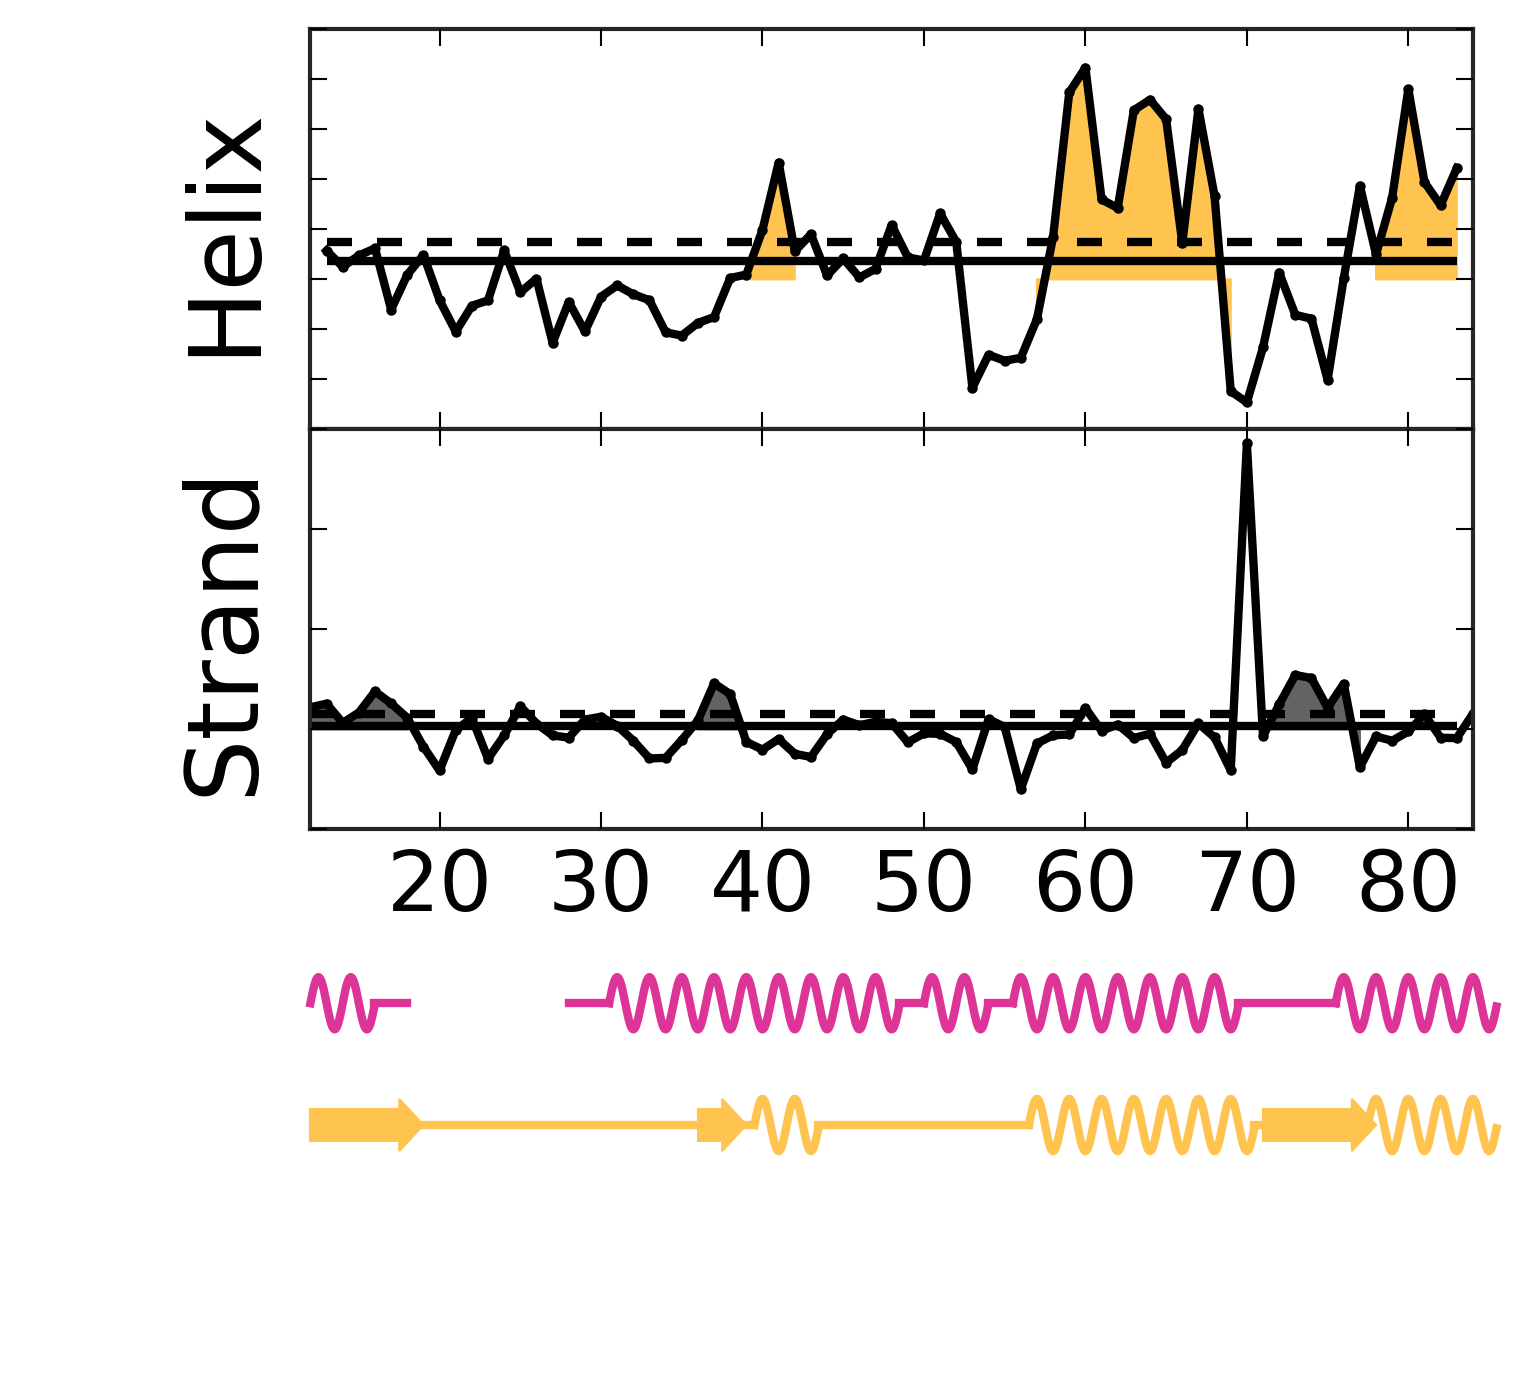
Secondary structure from ECs
EC score distribution and threshold
Top ECs
| Rank |
Residue 1 |
Amino acid 1 |
Residue 2 |
Amino acid 2 |
EC score |
| 1 |
57 |
E |
61 |
K |
0.71 |
| 2 |
62 |
E |
66 |
K |
0.63 |
| 3 |
65 |
E |
69 |
K |
0.61 |
| 4 |
61 |
K |
65 |
E |
0.57 |
| 5 |
63 |
L |
67 |
I |
0.49 |
| 6 |
78 |
K |
82 |
G |
0.47 |
| 7 |
58 |
K |
62 |
E |
0.46 |
| 8 |
35 |
D |
72 |
Y |
0.40 |
| 9 |
39 |
L |
43 |
A |
0.39 |
| 10 |
56 |
L |
60 |
V |
0.38 |
| 11 |
74 |
V |
79 |
V |
0.37 |
| 12 |
74 |
V |
82 |
G |
0.36 |
| 13 |
46 |
L |
50 |
D |
0.34 |
| 14 |
82 |
G |
88 |
T |
0.33 |
| 15 |
55 |
D |
73 |
E |
0.33 |
Alignment robustness analysis
First most common residue correlation
Second most common residue correlation